
Page 82 - 2015 Compass Now
P. 82
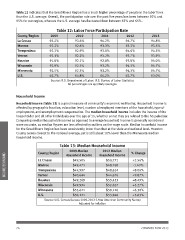
Table 12 indicates that the Great Rivers Region has a much higher percentage of people in the labor force
                 than the U.S. average. Overall, the participation rate over the past five years has been between 92% and
                 95% for our region, whereas the U.S. average has fluctuated from between 63% and 65%.

                                   Table 12: Labor Force Participation Rate

                 County/Region     2009   2010              2011              2012                     2013
                 La Crosse                                                                             94.8%
                 Monroe            93.2%  93.6%             94.2%             94.7%                    93.5%
                 Trempealeau                                                                           94.5%
                 Vernon            92.2%  92.6%             93.3%             93.3%                    93.9%
                 Houston                                                                               94.0%
                 Wisconsin         92.3%  92.9%             93.8%             94.6%                    94.7%
                 Minnesota                                                                             94.7%
                 U.S.              92.1%  92.2%             93.2%             93.7%                    63.0%

                                   91.8%  92.1%             92.8%             93.8%

                                   92.9%  92.3%             93.2%             94.3%

                                   92.5%  92.3%             93.2%             94.3%

                                   65.7%  64.8%             64.2%             63.7%

                                   Source: U.S. Department of Labor, U.S. Bureau of Labor Statistics
                                                    All percentages are quarterly averages

                 Household Income

                 Household income (Table 13) is a good measure of community’s economic well-being. Household income is
                 affected by geographic location, education level, number of employed members of the household, type of
                 employment, and unemployment compensation. The median household income includes the income of the
                 householder and all other individuals over the age of 15, whether or not they are related to the householder.
                 Comparing median household incomes as opposed to average household income is generally considered
                 more accurate, as median figures are less affected by outliers on the wage scale. Median household income
                 for the Great Rivers Region has been consistently lower than that at the state and national level. Houston
                 County comes closest to the national average, yet is still about 10% lower than the Minnesota median
                 household income.

                                          Table 13: Median Household Income

INCOME/ECONOMIC  County/Region               2009 Median       2012 Median    % Change
                                          Household Income  Household Income

                 La Crosse                $49,505           $50,771           +2.56%

                 Monroe                   $49,473           $48,768           -1.43%

                 Trempealeau              $44,997           $48,624           +8.06%

                 Vernon                   $40,644           $44,676           +9.87%

                 Houston                  $49,269           $53,453           +8.49%

                 Wisconsin                $49,994           $52,627           +5.27%

                 Minnesota                $55,621           $59,126           +6.30%

                 U.S.                     $50,221           $53,046           +5.63%

                                Source: U.S. Census Bureau 2009-2013 5-Year American Community Survey
                                                                  Adjusted for inflation

                 74 COMPASS NOW 2015