
Page 142 - 2015 Compass Now
P. 142
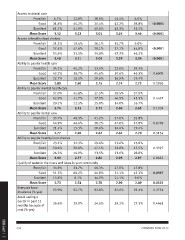
Access to dental care

              Poor/fair 6.7%                           12.9%  28.9%       14.4%  6.0%
                                                                          42.2%  38.8%
              Good 31.6%                               45.2%  30.4%       43.3%  55.2%  <0.0001
                                                                           3.24   3.46  <0.0001
              Excellent 61.7%                          41.9%  40.6%
                                                                          15.7%  9.0%   <0.0001
              Mean Score 3.52 3.23 3.01                                   37.1%  44.8%  <0.0001
                                                                          47.2%  46.3%
              Access to healthy food choices                               3.29   3.34  0.6008
                                                                                        0.2936
              Poor/fair 21.2%                          19.4%  26.1%       32.6%  34.3%
                                                                          50.6%  46.3%  0.4437
              Good 37.4%                               47.6%  39.1%       16.9%  19.4%  0.1209
                                                                           2.74   2.73
              Excellent 55.9%                          33.1%  34.8%                     0.6738
                                                                          39.5%  37.9%  0.3154
              Mean Score 3.48 3.11 3.03                                   46.5%  45.5%
                                                                          14.0%  16.7%  0.3397
              Ability to pay for health care                               2.60   2.65  0.0652

              Poor/fair 34.1%                          45.2%  33.9%       37.8%  32.8%  0.0397
                                                                          47.8%  47.8%  0.0231
              Good 43.2%                               38.7%  45.6%       14.4%  19.4%  0.2751
                                                                           2.62   2.70
              Excellent 22.7%                          16.1%  20.6%
                                                                          23.6%  25.8%
              Mean Score 2.80 2.60 2.75                                   52.8%  45.5%
                                                                          23.6%  28.8%
              Ability to pay for mental health care                        2.93   2.97

              Poor/fair 37.0%                          45.8%  37.5%       27.8%  47.8%
                                                                          51.1%  43.3%
              Good 42.9%                               41.7%  37.5%       21.1%  9.0%
                                                                           2.90   2.49
              Excellent 20.1%                          12.5%  25.0%
                                                                          87.6%  93.4%
              Mean Score 2.74 2.51 2.75

              Ability to pay for dental care

              Poor/fair 33.7%                          40.3%  41.2%

              Good 44.9%                               44.4%  38.2%

              Excellent 21.4%                          15.3%  20.6%

              Mean Score 2.77 2.60 2.62

              Ability to pay for healthy food choices

              Poor/fair 23.1%                          32.3%  29.4%

              Good 50.6%                               50.8%  47.1%

              Excellent 26.3%                          16.9%  23.5%

              Mean Score 3.00 2.77 2.84

              Quality of water in the rivers and lakes in your community

              Poor/fair 34.9%                          31.7%  40.3%

              Good 51.5%                               60.2%  44.8%

              Excellent 13.6%                          8.1%   14.9%

              Mean Score 2.73 2.74 2.70

              Everyone have          93.9%             92.7%  92.8%
              insurance (% yes)

              Avoid seeing a         26.6%             29.0%  24.6%       29.2%  27.3%  0.4461
              doctor in past 12
              months because of
              cost (% yes)

2 | APPENDIX  134 COMPASS NOW 2015