
Page 143 - 2015 Compass Now
P. 143
• Access to health care, dental care, mental health care, and access to healthy food choices varied by county of
residence, but ability to pay and overall mental health and dental health did not vary by county.
• La Crosse County residents rated access to health care, dental care, mental health, and healthy food
choices all higher than residents from the other four counties.
• Houston County residents also rated access highly.
• Nearly 28% of Trempealeau County residents rated access to health care as fair or poor, and 12% of Monroe
County residents indicated this.
• Nearly 30% of Trempealeau County residents rated access to dental care or access to mental health care as
fair or poor.
• About one-in-five respondents from Trempealeau County reported their overall health was fair or poor. This was
nearly double the rate in the other counties. About 30% of respondents from Houston and La Crosse Counties
indicated their health was excellent.
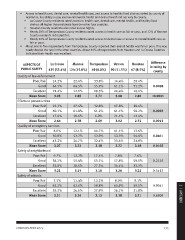
ASPECTS OF La Crosse Monroe Trempealeau Vernon Houston Difference
PUBLIC SAFETY 67 (8.5%) in rating by
435 (55.4%) 124 (15.8%) 69 (8.8%) 90 (11.5%)
28.4% county
Quality of law enforcement 55.2%
16.4% 0.0028
Poor/fair 14.2% 22.4% 33.8% 14.4% 2.82 <0.0001
64.5% 55.9% 61.1%
Good 64.5% 12.1% 10.3% 24.4% 28.4% 0.0002
2.85 2.72 3.08 58.2% 0.0013
Excellent 21.4% 13.4%
27.6% 32.8% 17.8% 2.72 0.0451
Mean Score 3.05 61.8% 61.2% 61.1% 0.0103
10.6% 6.0% 21.1% 13.6%
Efforts to prevent crime 2.78 2.69 3.02 54.6% 0.2129
31.8% 0.5412
Poor/fair 22.3% 12.1% 14.7% 11.1% 3.18
53.2% 52.9% 53.3% 0.9041
Good 60.1% 34.7% 32.4% 35.6% 7.6% 0.6809
3.22 3.18 3.22 59.1%
Excellent 17.6% 33.3%
12.2% 17.4% 7.8% 3.21
Mean Score 2.64 59.4% 55.1% 57.8%
28.5% 27.5% 34.4% 9.1%
Quality of emergency services 3.15 3.10 3.26 59.1%
31.8%
Poor/fair 6.0% 11.4% 13.2% 8.0% 3.21
62.6% 58.8% 65.9%
Good 50.8% 26.0% 27.9% 26.1%
3.14 3.13 3.18
Excellent 43.2%
Mean Score 3.37
Safety of neighborhood
Poor/fair 9.7%
Good 58.2%
Excellent 32.0%
Mean Score 3.21
Safety of schools
Poor/fair 7.5%
Good 63.2% 2 | APPENDIX
Excellent 29.3%
Mean Score 3.21
COMPASS NOW 2015 135