
Page 146 - 2015 Compass Now
P. 146
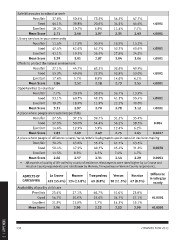
Safe bike routes to school or work

              Poor/fair 37.8%                     50.4%      73.5%  54.5%    47.7%

              Good 44.1%                          38.8%      20.6%  34.1%    44.6%      <.0001

              Excellent 18.2%                     10.7%      5.9%   11.4%    7.7%

              Mean Score  2.71                    2.46       1.97 2.35 2.43 <.0001

              Library services in your community

              Poor/fair 11.4%                     17.9%      30.9%  18.9%    15.2%

              Good 47.4%                          62.6%      42.7%  53.3%    60.6%      <.0001

              Excellent 41.1%                     19.5%      26.5%  27.8%    24.2%

              Mean Score  3.29                    3.01       2.87 3.04 3.06 <.0001

              Efforts to protect the natural environment

              Poor/fair 27.1%                     44.7%      63.2%  32.6%    40.9%

              Good 55.3%                          49.6%      27.9%  52.8%    53.0%      <.0001

              Excellent 17.6%                     5.7%       8.8%   14.6%    6.1%

              Mean Score  2.86                    2.52       2.18 2.73 2.55 <.0001

              Opportunities to volunteer

              Poor/fair 7.7%                      20.5%      38.8%  36.7%    13.9%

              Good 53.1%                          60.7%      49.3%  41.1%    55.4%      <.0001

              Excellent 39.2%                     18.9%      11.9%  22.2%    30.8%

              Mean Score  3.31                    2.97       2.70 2.78 3.12 <.0001

              A place where people are treated respectfully

              Poor/fair 27.5%                     37.1%      39.7%  31.5%    35.4%

              Good 57.9%                          50.0%      54.4%  56.2%    58.5%      0.004

              Excellent 14.6%                     12.9%      5.9%   12.4%    6.2%

              Mean Score  2.83                    2.69       2.49   2.75     2.65 0.0027

              A place where people of different cultural/racial/ethnic backgrounds are included in decision-making

              Poor/fair 38.2%                     43.8%      55.2%  47.7%    63.5%

              Good 50.4%                          47.9%      40.3%  45.4%    31.8%      0.0078

              Excellent 11.5%                     8.3%       4.5%   7.0%     4.7%

              Mean Score  2.66                    2.57       2.34   2.44     2.29 0.0002

              •	 All aspects of quality of life varied by county of residence. Most aspects were rated higher by La Crosse and
                   Houston County respondents and rated lower by Monroe, Trempealeau or Vernon County respondents.

              ASPECTS OF  La Crosse               Monroe Trempealeau Vernon  Houston    Difference
              CAREGIVING                                                     67 (8.5%)  in rating by
                          435 (55.4%) 124 (15.8%) 69 (8.8%) 90 (11.5%)
                                                                               23.8%       county
              Availability of quality child care                               57.1%
                                                                               19.1%      <0.0001
              Poor/fair 23.4%                     27.1%      66.7%  51.0%       2.90
                                                  50.0%      25.6%  34.7%                 <0.0001
              Good 54.7%                          22.9%      7.7%   14.3%
                                                   2.90       2.23   2.53
              Excellent 21.9%

              Mean Score  2.96

2 | APPENDIX  138 COMPASS NOW 2015