
Page 210 - 2015 Compass Now
P. 210
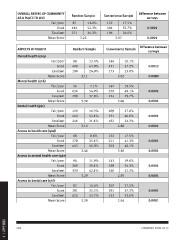
OVERALL RATING OF COMMUNITY               Random Sample  Convenience Sample  Difference between
              AS A PLACE TO LIVE                                                                  surveys
                                                        87 11.0%         132 17.5%
                                            Fair/poor   414 52.3%        404 53.7%                0.0001
                                                 Good   271 34.3%        196 26.0%
                                                                                                  0.0001
                                             Excellent         3.23              3.07
                                         Mean Score

              ASPECTS OF HEALTH                         Random Sample  Convenience Sample  Difference between
                                                                                                  surveys
              Overall health (q4a)                      98 12.4%
                                            Fair/poor   498 63.0%      144 19.1%           0.0012
                                                 Good   190 24.0%      431 57.2%           0.0080
                                             Excellent                 173 23.0%
                                                                3.11
                                         Mean Score                            3.02
              Mental health (q4b)                       56 7.1%
                                                        434 54.9%      147 19.5%           0.0001
                                            Fair/poor   299 37.8%      370 49.1%           0.0001
                                                 Good                  224 29.7%
                                                                3.30
                                             Excellent                         3.06
                                         Mean Score     129 16.3%
              Dental health (q4c)                       412 52.1%      209 27.8%           0.0001
                                                        246 31.1%      351 46.6%           0.0001
                                            Fair/poor                  182 24.2%
                                                 Good           3.10
                                                                               2.88
                                             Excellent  68 8.6%
                                         Mean Score     278 35.1%      132 17.5%           0.0001
              Access to health care (q4d)               443 56.0%      311 41.3%           0.0001
                                                                       302 40.1%
                                            Fair/poor           3.46
                                                 Good                          3.18
                                                        94 11.9%
                                             Excellent  309 39.1%      143 19.0%           0.0001
                                         Mean Score     333 42.1%      258 34.3%           0.0001
              Access to mental health care (q4e)                       160 21.2%
                                                                3.29
                                            Fair/poor                          2.95
                                                 Good   82 10.4%
                                                        281 35.5%      207 27.5%           0.0001
                                             Excellent  425 53.7%      281 37.3%           0.0001
                                         Mean Score                    253 33.6%
              Access to dental care (q4f)                       3.39
                                                                               2.94
                                            Fair/poor
                                                 Good

                                             Excellent
                                         Mean Score

4 | APPENDIX  202 COMPASS NOW 2015