
Page 212 - 2015 Compass Now
P. 212
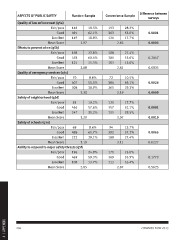
ASPECTS OF PUBLIC SAFETY             Random Sample       Convenience Sample  Difference between
                                                                                                  surveys

              Quality of law enforcement (q5a)

                                       Fair/poor 146            18.5%  193 28.2%
                                                                       363 53.0%
                                        Good 491                62.1%  121 17.7%           0.0001
                                                                                           0.0003
                                       Excellent 149            18.8%         2.83

              Mean Score                               2.97

              Efforts to prevent crime (q5b)

                                       Fair/poor 188            23.8%  188 27.4%
                                                                       381 55.6%
                                        Good 478                60.4%  103 15.0%           0.2047
                                                                                           0.0835
                                       Excellent 121            15.3%         2.81

              Mean Score                               2.88

              Quality of emergency services (q5c)

                                       Fair/poor   70           8.8%   72 10.5%
                                                                       384 56.1%
                                        Good 407                51.5%  201 29.3%           0.0026
                                                                                           0.0009
                                       Excellent 308            38.9%         3.19

              Mean Score                               3.30

              Safety of neighborhood (q5d)

                                       Fair/poor   81           10.2%  121 17.7%
                                                                       357 52.1%
                                        Good 456                57.6%  195 28.5%           0.0001
                                                                                           0.0010
                                       Excellent 247            31.2%         3.07

              Mean Score                               3.20

              Safety of schools (q5e)

                                       Fair/poor   68           8.6%   94 13.7%
                                                                       392 57.2%
                                        Good 488                61.7%  188 27.4%           0.0065
                                                                                           0.0227
                                       Excellent 222            28.1%         3.11

              Mean Score                               3.19

              Ability to respond to major safety threats (q5f)

                                       Fair/poor 196            24.8%  171 25.0%
                                                                       369 53.9%
                                        Good 469                59.3%  112 16.4%           0.1773
                                                                                           0.5625
                                       Excellent 108            13.7%         2.87

              Mean Score                               2.85

4 | APPENDIX  204 COMPASS NOW 2015