
Page 213 - 2015 Compass Now
P. 213
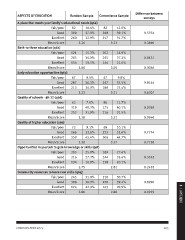
ASPECTS OF EDUCATION                 Random Sample Convenience Sample     Difference between
                                                                                 surveys
A place that meets your family’s educational needs (q6a)
                                                                                 0.5974
                  Fair/poor 82                 10.4%         82 12.0%            0.3840
                                                             268 39.1%
                      Good 300                 37.9%         217 31.7%           0.8431
                                                                                 0.3036
                      Excellent 260            32.9%                3.22
                                                                                 0.8144
                  Mean Score         3.26                    102 14.9%           0.6207
                                                             255 37.2%
Birth-to-three education (q6b)                               144 21.0%           0.0769
                                                                                 0.0946
                  Fair/poor 121                15.3%                3.05
                                                                                 0.7774
                      Good 285                 36.0%         67 9.8%             0.7738
                                                             257 37.5%
                      Excellent 154            19.5%         188 27.4%           0.3352
                                                                                 0.2455
                  Mean Score         3.00                           3.21
                                                                                 0.8996
Early education opportunities (q6c)                          80 11.7%            0.9919
                                                             275 40.1%
                  Fair/poor 67                 8.5%          216 31.5%

                      Good 287                 36.3%                3.21

                      Excellent 213            26.9%         69 10.1%
                                                             223 32.6%
                  Mean Score         3.23                    306 44.7%

Quality of schools - 4K-12 (q6d)                                    3.37

                  Fair/poor 62                 7.8%          189 27.6%
                                                             244 35.6%
                      Good 319                 40.3%         138 20.1%

                      Excellent 252            31.9%                2.81

                  Mean Score         3.28                    210 30.7%
                                                             270 39.4%
Quality of higher education (q6e)                            143 20.9%

                  Fair/poor 72                 9.1%                 2.80

                      Good 266                 33.6%

                      Excellent 359            45.4%

                  Mean Score         3.38

Opportunities in your job to gain knowledge or skills (q6f)

                  Fair/poor 205                25.9%

                      Good 216                 27.3%

                      Excellent 134            16.9%

                  Mean Score         2.75

Community resources to learn new skills (q6g)

                  Fair/poor 245                31.0%

                      Good 308                 38.9%

                      Excellent 174            22.0%                                               4 | APPENDIX

                  Mean Score         2.80

COMPASS NOW 2015                                                                              205