Page 232 - 2015 Compass Now
P. 232

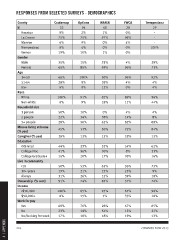
RESPONSES FROM SELECTED SURVEYS - DEMOGRAPHICS

              County                  Couleecap  Options  WAFER  YWCA  Trempealeau
              N                           32        94      68     28        29
                                          0%       2%       1%    0%          -
                 Houston                 75%       75%     97%   96%          -
                 La Crosse                6%       9%       0%    4%          -
                 Monroe                   0%        4%      0%    0%
                 Trempealeau             19%       10%      1%    0%       100%
                 Vernon
              Gender                     35%       15%     31%    4%        29%
                 Male                    65%       85%     69%   96%        71%
                 Female
              Age                        66%      100%     50%   96%        92%
                 14-50                   28%       0%      38%    4%         4%
                 51-64                    6%       0%      12%    0%         4%
                 65+
              Race                      100%       91%     82%   89%        56%
                 White                    0%       9%      18%   11%        44%
                 Non-white
              Household size             50%       16%      0%    4%         4%
                 1 person                22%       34%     38%   14%         8%
                 2 people                28%       50%     62%   82%        88%
                 3+ people                                                  84%
              Minors living at home      45%       33%     50%   72%        13%
              (% yes)
              Caregiver (% yes)          28%       13%     13%   18%        63%
              Education                                                     21%
                 <HS Grad                44%       23%     53%   54%        16%
                 College/Voc             41%       56%     30%    8%
                 College Graduate+       16%       20%     17%   38%        73%
              Live in community                                              9%
                 <10                     50%       53%     63%   36%        18%
                 10+ years               19%       21%     25%   25%        74%
                 Always                  31%       26%     12%   39%
              Ownership (% rent)         91%       74%     83%   57%        90%
              Income                                                        10%
                 <$50,000               100%       85%     93%   67%
                 $50,000+                 0%       15%      7%   33%        65%
              Work for pay                                                  22%
                 Yes                     60%       76%     28%   67%        13%
                 No                      23%       14%     54%   15%
                 No/looking for work     17%       10%     18%   19%

4 | APPENDIX  224 COMPASS NOW 2015
   227   228   229   230   231   232   233   234   235   236   237