Page 229 - 2015 Compass Now
P. 229

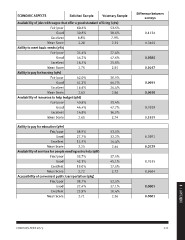
ECONOMIC ASPECTS                    Solicited Sample          Voluntary Sample  Difference between
                                                                                       surveys
Availability of jobs with wages that offer a good standard of living (q9a)
                                                                                       0.1134
                  Fair/poor         60.4%                     53.5%                    0.3465

                  Good              30.8%                     38.6%                    0.0385
                                                                                       0.0167
                  Excellent         8.8%                      7.9%
                                                                                       0.0055
                  Mean Score        2.28                      2.35                     0.0010

Ability to meet basic needs (q9b)                                                      0.3929
                                                                                       0.1859
                  Fair/poor         35.4%                     27.4%
                                                                                       0.3991
                  Good              46.2%                     47.6%                    0.0229

                  Excellent         18.5%                     25.0%                    0.7635
                                                                                       0.9664
                  Mean Score        2.75                      2.91
                                                                                       0.0001
Ability to pay for housing (q9c)                                                       0.0001

                  Fair/poor         42.0%                     30.9%

                  Good              41.3%                     44.7%

                  Excellent         16.6%                     24.4%

                  Mean Score        2.63                      2.86

Availability of resources to help budget (q9d)

                  Fair/poor         40.8%                     35.4%

                  Good              44.4%                     47.7%

                  Excellent         14.8%                     16.9%

                  Mean Score        2.65                      2.74

Ability to pay for education (q9e)

                  Fair/poor         58.9%                     53.5%
                                                              32.2%
                  Good              27.7%                     14.4%
                                                               2.44
                  Excellent         13.5%
                                                              37.5%
                  Mean Score        2.25                      45.1%
                                                              17.5%
Availability of services for people needing extra help (q9f)   2.72

                  Fair/poor         38.7%                     52.5%
                                                              37.1%
                  Good              42.3%                     10.4%
                                                               2.36
                  Excellent         19.0%

                  Mean Score        2.72

Accessibility of convenient public transportation (q9g)

                  Fair/poor         38.7%

                  Good              37.4%                                                           4 | APPENDIX

                  Excellent         23.9%

                  Mean Score        2.71

COMPASS NOW 2015                                                                221
   224   225   226   227   228   229   230   231   232   233   234