Page 235 - 2015 Compass Now
P. 235

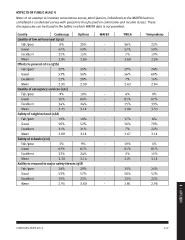
ASPECTS OF PUBLIC HEALTH

Note: In an attempt to increase convenience survey participation, individuals at the WAFER location
completed a condensed survey with questions that focused on community and income issues. These
discrepancies can be found in the tables in which WAFER data is not provided.

County                   Couleecap   Options      WAFER  YWCA  Trempealeau

Quality of law enforcement (q5a)                     -   36%        22%
                                                     -   57%        59%
Fair/poor                       6% 26%               -    7%        19%
                                                     -   2.68       2.96
Good                     47%         59%
                                                     -   37%        24%
Excellent                22%         15%             -   56%        60%
                                                     -    7%        16%
Mean                     2.84 2.86                   -   2.63       2.84

Efforts to prevent crime (q5b)                       -    4%         0%
                                                     -   81%        67%
Fair/poor                25%         25%             -   15%        33%
                                                     -   3.08       3.33
Good                     53%         56%
                                                     -   37%         8%
Excellent                22%         20%             -   56%        70%
                                                     -    7%        22%
Mean                     2.91 2.90                   -   2.67       3.11

Quality of emergency services (q5c)                  -   19%         4%
                                                     -   81%        81%
Fair/poor                       9% 10%               -    0%        15%
                                                     -   2.81       3.11
Good                     56%         66%
                                                     -   35%        26%
Excellent                34%         24%             -   50%        52%
                                                     -   15%        22%
Mean                     3.25 3.11                   -   2.81       2.96

Safety of neighborhood (q5d)

Fair/poor                19%         18%

Good                     50%         52%

Excellent                31%         31%

Mean                     3.09 3.11

Safety of schools (q5e)

Fair/poor                       3% 9%

Good                     63%         67%

Excellent                33%         24%

Mean                     3.30 3.14

Ability to respond to major safety threats (q5f)

Fair/poor                28%         20%

Good                     53%         57%

Excellent                19%         23%

Mean                     2.91 3.00                                                                        4 | APPENDIX

COMPASS NOW 2015                                                                                     227
   230   231   232   233   234   235   236   237   238   239   240