
Page 240 - 2015 Compass Now
P. 240
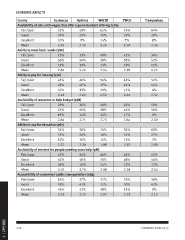
ECONOMIC ASPECTS

              County            Couleecap         Options              WAFER              YWCA  Trempealeau

              Availability of jobs with wages that offer a good standard of living (q9a)  74%        64%
                                                                                          19%        28%
              Fair/poor         52% 58% 65%                                                7%         8%
                                                                                          2.19       2.36
              Good              39% 33% 21%
                                                                                          42%        36%
              Excellent         10% 9% 14%                                                38%        52%
                                                                                          19%        12%
              Mean              2.35 2.35 2.25                                            2.58       2.72

              Ability to meet basic needs (q9b)                                           44%        52%
                                                                                          44%        44%
              Fair/poor         25% 33% 49%                                               12%         4%
                                                                                          2.44       2.52
              Good              56% 54% 38%
                                                                                          40%        50%
              Excellent         19% 13% 13%                                               44%        50%
                                                                                          17%         0%
              Mean              2.84 2.74 2.54                                            2.64       2.50

              Ability to pay for housing (q9c)                                            54%        68%
                                                                                          31%        27%
              Fair/poor         45% 40% 54%                                               15%         5%
                                                                                          2.35       2.09
              Good              45% 47% 27%
                                                                                          42%        42%
              Excellent         10% 13% 19%                                               46%        46%
                                                                                          12%        12%
              Mean              2.42 2.62 2.52                                            2.58       2.54

              Availability of resources to help budget (q9d)                              35%        58%
                                                                                          50%        42%
              Fair/poor         29% 36% 40%                                               15%         0%
                                                                                          2.73       2.13
              Good              52% 49% 38%

              Excellent         19%               14%                       22%

              Mean              2.84 2.71 2.75

              Ability to pay for education (q9e)

              Fair/poor         54%               58%                       70%

              Good              35%               26%                       16%

              Excellent         12%               16%                       14%

              Mean              2.27              2.30                      1.98

              Availability of services for people needing extra help (q9f)

              Fair/poor         23%               34%                       46%

              Good              42%               50%                       30%

              Excellent         36%               16%                       24%

              Mean              3.10              2.76                      2.68

              Accessibility of convenient public transportation (q9g)

              Fair/poor         16%               37%                       31%

              Good              39%               41%                       31%

              Excellent         45%               22%                       38%

              Mean              3.19              2.72                      2.97

4 | APPENDIX  232 COMPASS NOW 2015