
Page 159 - 2015 Compass Now
P. 159
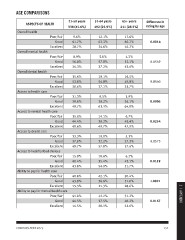
AGE COMPARISONS

ASPECTS OF HEALTH                      21-50 years  51-64 years   65+ years   Difference in
                                       338 (45.6%)  192 (25.9%)  211 (28.5%)  rating by age

Overall health                                         12.1%        17.6%        0.0014
                                                       63.3%        66.2%        0.0549
                       Poor/fair       9.6%            24.6%        16.2%        0.8540
                                                                                 0.0006
                       Good            61.7%            5.0%         4.3%        0.0254
                                                       57.8%        52.1%        0.0573
                       Excellent       28.7%           37.2%        43.6%        0.0119
                                                                                  <.0001
Overall mental health                                  18.1%        16.5%        0.0167
                                                       54.8%        49.8%
                       Poor/fair       8.9%            27.1%        33.7%

                       Good            56.8%            8.5%         1.9%
                                                       30.2%        34.1%
                       Excellent       34.3%           61.3%        64.0%

Overall dental health                                  14.1%         6.7%
                                                       36.2%        45.4%
                       Poor/fair       15.6%           49.7%        47.9%

                       Good            53.8%           10.0%         5.1%
                                                       32.2%        37.3%
                       Excellent       30.6%           57.8%        57.6%

Access to health care                                  10.6%         6.2%
                                                       35.4%        42.1%
                       Poor/fair       11.3%           54.0%        51.7%

                       Good            39.0%           42.1%        20.4%
                                                       36.6%        51.0%
                       Excellent       49.7%           21.3%        28.6%

Access to mental health care                           42.2%        31.2%
                                                       37.5%        46.2%
                       Poor/fair       15.0%           20.3%        22.6%

                       Good            44.4%

                       Excellent       40.6%

Access to dental care

                       Poor/fair       13.3%

                       Good            37.0%

                       Excellent       49.7%

Access to healthy food choices

                       Poor/fair       15.8%

                       Good            40.4%

                       Excellent       43.8%

Ability to pay for health care

                       Poor/fair       40.8%

                       Good            43.9%

                       Excellent       15.3%                                                 2 | APPENDIX

Ability to pay for mental health care

                       Poor/fair       41.0%

                       Good            44.5%

                       Excellent       14.5%

COMPASS NOW 2015                                                              151