Page 161 - 2015 Compass Now
P. 161

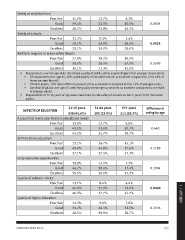
Safety of neighborhood

                   Poor/fair      11.9%             12.7%        5.2%

                            Good  59.4%             53.5%        60.5%        0.0605

                   Excellent      28.7%             33.8%        34.3%

Safety of schools

                   Poor/fair      12.2%             9.3%         2.4%

                            Good  59.7%             59.8%        69.6%        0.0035

                   Excellent      28.1%             30.9%        28.0%

Ability to respond to major safety threats

                   Poor/fair      27.0%             29.2%        16.9%

                            Good  58.9%             58.5%        67.6%        0.0999

                   Excellent      14.1%             12.3%        15.5%

•	 Respondents over the age of 65 rated most quality of public safety aspects higher than younger respondents.
    •	 Of respondents over age 65, 26% rated quality of law enforcement as excellent compared to 13 to 18% of
         those younger than 65.
    •	 Of older adults, 23% rated efforts to prevent crime as excellent compared to 9 to 14% of younger adults.
    •	 Over half of adults over age 65 rated the quality of emergency services as excellent compared to one third
         of younger adults.

•	 Respondents 21 to 50 years of age were more likely to rate safety of schools as fair or poor (12%) than older
     adults.

ASPECTS OF EDUCATION              21-50 years       51-64 years   65+ years   Difference in
                                  338 (45.6%)       192 (25.9%)  211 (28.5%)  rating by age

A place that meets your family’s educational needs     12.7%         9.6%         0.463
                                                       51.6%        50.7%
                   Poor/fair      13.0%                35.7%        39.7%        0.1788

                            Good  43.5%                26.7%        15.1%        0.3384
                                                       45.8%        57.6%
                   Excellent      43.5%                27.5%        27.3%        0.0404

Birth-to-three education                               13.0%         7.3%        0.2936
                                                       50.4%        57.4%
                   Poor/fair      23.1%                36.6%        35.3%

                            Good  49.8%                 8.4%         4.4%
                                                       53.9%        53.9%
                   Excellent      27.1%                37.7%        41.7%

Early education opportunities                           9.0%         7.8%
                                                       40.1%        33.5%
                   Poor/fair      13.8%                50.9%        58.7%

                            Good  46.7%

                   Excellent      39.5%

Quality of schools - 4K-12

                   Poor/fair      13.1%                                                                            2 | APPENDIX

                            Good  46.0%

                   Excellent      40.9%

Quality of higher education

                   Poor/fair      12.3%

                            Good  39.2%

                   Excellent      48.5%

COMPASS NOW 2015                                                                      153
   156   157   158   159   160   161   162   163   164   165   166