
Page 160 - 2015 Compass Now
P. 160
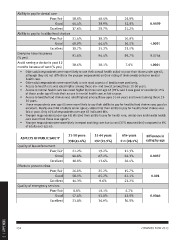
Ability to pay for dental care

              Poor/fair                                38.0%       40.4%        25.9%

                                       Good            44.4%       38.9%        52.9%        0.0039

              Excellent                                17.6%       20.7%        21.2%

              Ability to pay for healthy food choices

              Poor/fair                                31.4%       30.3%        10.0%

                                       Good            49.9%       44.4%        56.5%        <.0001

              Excellent                                18.7%       25.3%        33.5%

              Everyone have insurance                  91.0%       94.4%        95.7%        0.0744
              (% yes)

              Avoid seeing a doctor in past 12         38.6%       28.1%        7.6%         <.0001
              months because of cost (% yes)

              •	 Older adult respondents were more likely to rate their overall health as fair or poor than those under age 65,
                   although they did not differ from the younger respondents on their rating of their overall dental or mental
                   health care.

              •	 Older adult respondents were more likely to rate most aspects of health more positively.
              •	 Access to health care was rated higher among those 65+ and lowest among those 21-50 years.
              •	 Access to mental health care was rated higher by those over age 65 (93% said it was good or excellent); 15%

                   of those under age 65 rate their access to mental health care as fair or poor.
              •	 Access to healthy food choices was rated highest among those ages 51-64 years and lowest among those 21-

                   50 years.
              •	 Those respondents over age 65 were more likely to say their ability to pay for healthy food choices was good or

                   excellent. Nearly one-third of adults under age 65 stated that their ability to pay for healthy food choices was
                   fair or poor. Only 10% of respondents over age 65 indicated this.
              •	 Younger respondents (under age 65) all rated their ability to pay for health care, dental care and mental health
                   care lower than those over age 65.
              •	 Younger respondents were more likely to report avoiding care due to cost (37% reported this) compared to 8%
                   of adults over age 65.

                ASPECTS OF PUBLIC SAFETY              21-50 years  51-64 years   65+ years   Difference in
                                                      338 (45.6%)  192 (25.9%)  211 (28.5%)  rating by age
              Quality of law enforcement
                                           Poor/fair     21.2%        19.2%        11.3%        0.0037
                                                Good     60.8%        67.2%        62.3%
                                           Excellent     18.0%        13.6%        26.4%         0.001

              Efforts to prevent crime                   26.8%        25.2%        15.7%        0.0046
                                           Poor/fair     58.9%        65.2%        61.1%
                                                Good     14.3%         9.6%        23.2%
                                           Excellent
                                                          8.8%        10.1%         6.2%
              Quality of emergency services              57.4%        53.0%        42.9%
                                           Poor/fair     33.8%        36.9%        50.9%
                                                Good
                                           Excellent

2 | APPENDIX  152 COMPASS NOW 2015