
Page 217 - 2015 Compass Now
P. 217
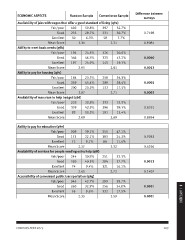
ECONOMIC ASPECTS                    Random Sample Convenience Sample        Difference between
                                                                                   surveys
Availability of jobs with wages that offer a good standard of living (q9a)
                                                                                   0.7198
                  Fair/poor 402                 50.8% 397     52.7%                0.9081

                  Good 235                      29.7% 231     30.7%                0.0060
                                                                                   0.0013
                  Excellent 50 6.3% 58 7.7%
                                                                                   0.0001
                  Mean Score        2.31                      2.31                 0.0001

Ability to meet basic needs (q9b)                                                  0.0531
                                                                                   0.8834
                  Fair/poor 194                 24.5% 226     30.0%
                                                                                   0.7083
                  Good 366                      46.3% 325     43.2%                0.4336

                  Excellent 197                 24.9% 145     19.3%                0.0013
                                                                                   0.1407
                  Mean Score        2.95                      2.81
                                                                                   0.0001
Ability to pay for housing (q9c)                                                   0.0001

                  Fair/poor 184                 23.3% 258     34.3%

                  Good 359                      45.4% 289     38.4%

                  Excellent 200                 25.3% 132     17.5%

                  Mean Score        2.97                      2.71

Availability of resources to help budget (q9d)

                  Fair/poor 228                 28.8% 252     33.5%

                  Good 339                      42.9% 296     39.3%

                  Excellent 83                  10.5% 101     13.4%

                  Mean Score        2.69                      2.69

Ability to pay for education (q9e)

                  Fair/poor 309                 39.1% 355     47.1%

                  Good 175                      22.1% 183     24.3%

                  Excellent 72                  9.1% 86 11.4%

                  Mean Score        2.37                      2.32

Availability of services for people needing extra help (q9f)

                  Fair/poor 244                 30.8% 251     33.3%

                  Good 320                      40.5% 284     37.7%

                  Excellent 74                  9.4% 121 16.1%

                  Mean Score        2.65                      2.72

Accessibility of convenient public transportation (q9g)

                  Fair/poor 346                 43.7% 299     39.7%

                  Good 260                      32.9% 256     34.0%                                  4 | APPENDIX

                  Excellent 76                  9.6% 132 17.5%

                  Mean Score        2.35                      2.59

COMPASS NOW 2015                                                                                209