Page 220 - 2015 Compass Now
P. 220

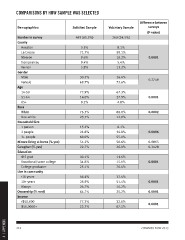
COMPARISONS BY HOW SAMPLE WAS SELECTED

              Demographics:                  Solicited Sample  Voluntary Sample  Difference between
                                                                  260 (34.5%)           surveys
              Number in survey                 493 (65.5%)
              County                                                                   (P-value)
                                                    3.5%
                 Houston                           71.7%       8.1%              0.0001
                 La Crosse                          9.6%       59.1%
                 Monroe                             9.4%       16.2%
                 Trempealeau                        5.8%       5.4%
                 Vernon                                        11.2%
              Gender                               30.3%
                 Male                              69.7%       26.4%             0.2749
                 Female                                        73.6%
              Age                                  77.9%
                 14-50                             14.0%       67.3%             0.0001
                 51-64                              8.2%       27.9%
                 65+                                           4.8%
              Race                                 76.3%
                 White                             23.7%       88.0%             0.0002
                 Non-white                                     12.0%
              Household Size                       15.2%
                 1 person                          24.8%       8.1%              0.0006
                 2 people                          60.0%       36.8%
                 3+ people                         51.2%       55.0%             0.8865
              Minors living at home (% yes)        22.7%       50.6%             0.3428
              Caregiver (% yes)                                26.0%
              Education                            40.1%
                 <HS grad                          34.8%       11.6%             0.0001
                 Vocational/some college           25.1%       15.1%
                 College graduate+                             76.4%
              Live in community                    46.4%
                 <10 years                         26.9%       32.4%             0.0001
                 10+ years                         26.7%       51.4%             0.0001
                 Always                            64.7%       16.2%
              Ownership (% rent)                               25.2%
              Income                               77.3%
                 <$50,000                          22.7%       32.6%             0.0001
                 $50,0000+                                     67.5%

4 | APPENDIX  212 COMPASS NOW 2015
   215   216   217   218   219   220   221   222   223   224   225