
Page 224 - 2015 Compass Now
P. 224
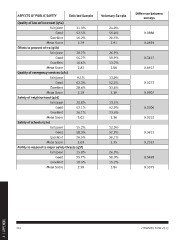
ASPECTS OF PUBLIC SAFETY             Solicited Sample  Voluntary Sample  Difference between
                                                                                              surveys
              Quality of law enforcement (q5a)                              24.0%
                                                                            55.4%             0.0886
              Fair/poor                            31.3%                    20.5%             0.0593
                                                                             2.91
                                       Good        52.5%                                      0.3417
                                                                            26.9%             0.6617
                                       Excellent   16.2%                    59.9%
                                                                            13.2%             0.0272
              Mean Score                           2.79                      2.80             0.9907

              Efforts to prevent crime (q5b)                                13.9%             0.0206
                                                                            52.5%             0.0225
              Fair/poor                            28.7%                    33.6%
                                                                             3.19             0.3812
                                       Good        54.7%                                      0.2352
                                                                            13.5%
                                       Excellent   16.6%                    52.9%             0.5499
                                                                            33.6%             0.3375
              Mean Score                           2.82                      3.16

              Quality of emergency services (q5c)                           12.0%
                                                                            57.9%
              Fair/poor                            9.1%                     30.1%
                                                                             3.15
                                       Good        62.3%
                                                                            26.9%
                                       Excellent   28.6%                    58.0%
                                                                            15.2%
              Mean Score                           3.19                      2.84

              Safety of neighborhood (q5d)

              Fair/poor                            20.8%

                                       Good        53.1%

                                       Excellent   26.1%

              Mean Score                           3.02

              Safety of schools (q5e)

              Fair/poor                            15.2%

                                       Good        58.3%

                                       Excellent   26.5%

              Mean Score                           3.09

              Ability to respond to major safety threats (q5f)

              Fair/poor                            25.8%

                                       Good        55.7%

                                       Excellent   18.5%

              Mean Score                           2.90

4 | APPENDIX  216 COMPASS NOW 2015