Page 225 - 2015 Compass Now
P. 225

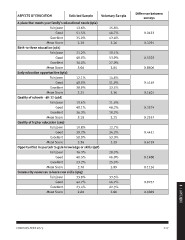
ASPECTS OF EDUCATION                 Solicited Sample        Voluntary Sample  Difference between
                                                                                      surveys
A place that meets your family’s educational needs (q6a)
                                                                                      0.0433
                  Fair/poor          13.6%                   15.8%                    0.3291
                                                             40.7%
                      Good           51.5%                   43.4%                    0.5329
                                                              3.26                    0.8506
                  Excellent          35.0%
                                                             19.1%                    0.4149
                  Mean Score         3.20                    53.9%                    0.1401
                                                             27.0%
Birth-to-three education (q6b)                                3.04                    0.3574
                                                                                      0.2557
                  Fair/poor          21.2%                   14.6%
                                                             51.9%                    0.4421
                      Good           48.8%                   33.5%                    0.6759
                                                              3.16
                  Excellent          30.0%                                            0.1480
                                                             11.6%                    0.1126
                  Mean Score         3.06                    48.2%
                                                             10.2%                    0.9237
Early education opportunities (q6c)                           3.25                    0.9889

                  Fair/poor          12.1%                   12.7%
                                                             34.3%
                      Good           49.0%                   53.0%
                                                              3.39
                  Excellent          38.9%
                                                             28.5%
                  Mean Score         3.25                    46.0%
                                                             25.5%
Quality of schools - 4K-12 (q6d)                              2.89

                  Fair/poor          15.6%                   33.5%
                                                             44.2%
                      Good           48.1%                   22.3%
                                                              2.80
                  Excellent          36.3%

                  Mean Score         3.18

Quality of higher education (q6e)

                  Fair/poor          10.8%

                      Good           39.2%

                  Excellent          50.0%

                  Mean Score         3.36

Opportunities in your job to gain knowledge or skills (q6f)

                  Fair/poor          36.3%

                      Good           40.5%

                  Excellent          23.2%

                  Mean Score         2.76

Community resources to learn new skills (q6g)

                  Fair/poor          33.9%

                      Good           42.7%

                  Excellent          23.4%                                                              4 | APPENDIX

                  Mean Score         2.80

COMPASS NOW 2015                                                                                   217
   220   221   222   223   224   225   226   227   228   229   230