
Page 165 - 2015 Compass Now
P. 165
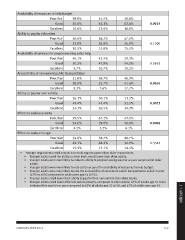
Availability of resources to help budget

                  Poor/fair               38.8%         41.5%  20.8%

                           Good           50.6%         45.1%  62.4%  0.0015

                  Excellent               10.6%         13.4%  16.8%

Ability to pay for education

                  Poor/fair               56.6%         58.2%  47.6%

                           Good           32.9%         26.0%  36.9%  0.1200

                  Excellent               10.5%         15.8%  15.5%

Availability of services for people needing extra help

                  Poor/fair               40.1%         42.3%  29.3%

                           Good           50.2%         47.0%  54.5%  0.0853

                  Excellent               9.7%          10.7%  16.2%

Accessibility of convenient public transportation

                  Poor/fair               51.8%         58.7%  40.9%

                           Good           38.9%         33.7%  41.4%  0.0055

                  Excellent               9.3%          7.6%   17.7%

Ability to pay for own vehicle

                  Poor/fair               26.3%         30.1%  13.2%

                           Good           49.4%         43.4%  52.5%  0.0023

                  Excellent               24.3%         26.5%  34.3%

Efforts to reduce poverty

                  Poor/fair               59.5%         67.2%  43.1%

                           Good           34.0%         29.6%  50.8%  0.0002

                  Excellent               6.5%          3.2%   6.1%

Efforts to reduce hunger

                  Poor/fair               34.8%         38.7%  28.7%

                           Good           49.3%         48.2%  56.9%  0.3563

                  Excellent               15.9%         13.1%  14.4%

•	 Younger respondents rated several economic aspects poorer than older respondents.                                  2 | APPENDIX
    •	 Younger adults rated the ability to meet basic needs lower than older adults.
    •	 Younger adults were more likely to indicate ability to pay for housing was fair or poor compared to older
         adults.
    •	 Younger adults were more likely to rate as fair or poor the availability of resources to help budget.
    •	 Younger adults were more likely to rate the accessibility of convenient public transportation as fair or poor
         (52% to 59%) compared to adults over age 65 (41%).
    •	 Younger adults rated lower their ability to pay for their own vehicle than older adults.
    •	 Younger adults rated lower efforts to reduce poverty, compared to older adults; 67% of adults age 51 to 64
         indicated this was fair or poor compared to 60% of adults age 21 to 50, and 43% of adults over age 65.

COMPASS NOW 2015                                                              157