
Page 168 - 2015 Compass Now
P. 168
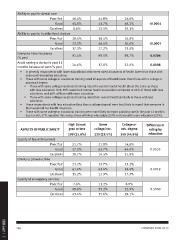
Ability to pay for dental care

              Poor/fair                                46.4%        44.8%         24.6%

                                       Good            45.0%        41.7%         46.3%        <0.0001

              Excellent                                8.6%         13.5%         29.1%

              Ability to pay for healthy food choices

              Poor/fair                                29.4%        36.4%         16.0%

                                       Good            53.3%        46.4%         50.6%        <0.0001

              Excellent                                17.3%        17.2%         33.4%

              Everyone have insurance                  91.4%        90.5%         95.7%        0.0304
              (% yes)

              Avoid seeing a doctor in past 12         24.6%        37.0%         22.0%        0.0008
              months because of cost (% yes)

              •	 In general, respondents with lower educational attainment rated all aspects of health lower than those with
                   some post-secondary education.

              •	 Those with some college or vocational training rated all aspects of health lower than those with a college or
                   advanced degree.
                  •	 Those with some college/vocational training rated the overall mental health about the same as those
                       with less education. Only 30% rated their mental health as excellent compared to 33% of those with less
                       education, and 46% of those with more education.
                  •	 Those with some college/vocational training rated their overall health similarly to those with less
                       education.

              •	 Those respondents with less education (less than a college degree) were less likely to report that everyone in
                   the household has health insurance.

              •	 Those with some college or vocational training were more likely to report avoiding care in the past 12 months
                   due to cost; 37% reported this versus those with less education (25%) or those with more education (22%).

                ASPECTS OF PUBLIC SAFETY              High School       Some       College or  Difference in
                                                      grad or less  college/voc.  adv. degree    rating by
              Quality of law enforcement              199 (25.6%)   230 (29.5%)   350 (44.9%)   education
                                           Poor/fair
                                                Good     21.7%         21.8%         14.6%        0.0555
                                           Excellent     57.6%         63.7%         64.4%
                                                         20.7%         14.5%         21.0%        0.4918
              Efforts to prevent crime
                                           Poor/fair     23.2%         25.7%         23.3%        0.5940
                                                Good     61.6%         61.4%         59.4%
                                           Excellent     15.2%         12.9%         17.3%

              Quality of emergency services               7.6%         11.2%          8.0%
                                           Poor/fair     49.0%         53.2%         52.9%
                                                Good     43.4%         35.6%         39.1%
                                           Excellent

2 | APPENDIX  160 COMPASS NOW 2015