
Page 169 - 2015 Compass Now
P. 169
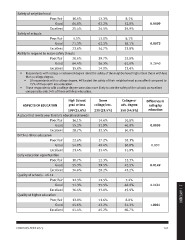
Safety of neighborhood

                   Poor/fair      10.6%             13.3%         8.1%

                            Good  64.0%             62.2%         52.0%        0.0009

                   Excellent      25.4%             24.5%         39.9%

Safety of schools

                   Poor/fair      5.1%              13.0%         8.1%

                            Good  71.3%             62.3%         58.1%        0.0073

                   Excellent      23.6%             24.7%         33.8%

Ability to respond to major safety threats

                   Poor/fair      20.6%             29.7%         25.0%

                            Good  64.4%             56.3%         61.6%        0.2840

                   Excellent      15.0%             14.0%         13.4%

•	 Respondents with college or advanced degree rated the safety of the neighborhood higher than those with less
     than a college degree.
    •	 Of respondents with a college degree, 40% rated the safety of their neighborhood as excellent compared to
         25% of those with less education.

•	 Those respondents with a college degree were also more likely to rate the safety of the schools as excellent
     compared to only 24% of those with less education.

ASPECTS OF EDUCATION              High School           Some       College or  Difference in
                                  grad or less      college/voc.  adv. degree    rating by
                                                    230 (29.5%)   350 (44.9%)   education
                                  199 (25.6%)                                     0.0005
                                                       14.6%         10.0%
A place that meets your family’s educational needs     51.9%         40.0%         0.093
                                                       33.5%         50.0%
                   Poor/fair      16.1%                                           0.0149
                                                       27.2%         18.1%
                            Good  55.2%                49.4%         50.0%        0.0681
                                                       23.4%         31.9%
                   Excellent      28.7%                                           <.0001
                                                       12.3%         12.3%
Birth-to-three education                               59.5%         42.5%
                                                       28.2%         45.2%
                   Poor/fair      22.6%
                                                       11.5%          7.2%
                            Good  54.0%                55.5%         46.9%
                                                       33.0%         45.9%
                   Excellent      23.4%
                                                       11.6%          8.0%
Early education opportunities                          43.2%         31.3%
                                                       45.2%         60.7%
                   Poor/fair      10.7%

                            Good  55.3%

                   Excellent      34.0%

Quality of schools - 4K-12

                   Poor/fair      12.3%

                            Good  51.3%                                                                           2 | APPENDIX

                   Excellent      36.4%

Quality of higher education

                   Poor/fair      13.0%

                            Good  45.6%

                   Excellent      41.4%

COMPASS NOW 2015                                                                       161