
Page 167 - 2015 Compass Now
P. 167
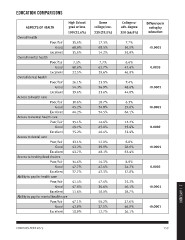
EDUCATION COMPARISONS

ASPECTS OF HEALTH                      High School       Some       College or  Difference in
                                       grad or less  college/voc.  adv. degree    rating by
                                                     230 (29.5%)   350 (44.9%)   education
                                       199 (25.6%)                                <0.0001
                                                        17.3%          7.7%
Overall health                                          68.5%         56.5%        0.0035
                                                        14.2%         35.8%
                       Poor/fair       15.6%                                      <0.0001
                                                         7.7%          6.6%
                       Good            68.8%            62.7%         47.4%       <0.0001
                                                        29.6%         46.0%
                       Excellent       15.6%                                       0.0002
                                                        21.5%          7.4%
Overall mental health                                   56.9%         48.6%       <0.0001
                                                        21.6%         44.0%
                       Poor/fair       7.5%                                        0.0002
                                                        10.7%          6.3%
                       Good            60.0%            34.8%         29.6%       <0.0001
                                                        54.5%         64.1%
                       Excellent       32.5%                                      <0.0001
                                                        14.6%         12.2%
Overall dental health                                   45.0%         35.4%
                                                        40.4%         52.4%
                       Poor/fair       26.1%
                                                        12.0%          8.0%
                       Good            54.3%            39.9%         28.6%
                                                        48.1%         63.4%
                       Excellent       19.6%
                                                        14.3%          8.0%
Access to health care                                   42.4%         34.2%
                                                        43.3%         57.8%
                       Poor/fair       10.6%
                                                        47.4%         25.2%
                       Good            45.2%            36.6%         46.1%
                                                        16.0%         28.7%
                       Excellent       44.2%
                                                        50.2%         27.0%
Access to mental health care                            37.1%         46.9%
                                                        12.7%         26.1%
                       Poor/fair       15.1%

                       Good            49.7%

                       Excellent       35.2%

Access to dental care

                       Poor/fair       13.1%

                       Good            43.2%

                       Excellent       43.7%

Access to healthy food choices

                       Poor/fair       14.6%

                       Good            47.7%

                       Excellent       37.7%

Ability to pay for health care

                       Poor/fair       41.4%

                       Good            47.0%                                                   2 | APPENDIX

                       Excellent       11.6%

Ability to pay for mental health care

                       Poor/fair       47.1%

                       Good            42.0%

                       Excellent       10.9%

COMPASS NOW 2015                                                                159