
Page 172 - 2015 Compass Now
P. 172
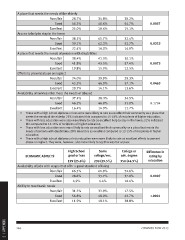
A place that meets the needs of the elderly

              Poor/fair                            28.7%                 34.8%      30.2%

                                Good               46.3%                 46.6%      54.7%        0.0037

              Excellent                            25.0%                 18.6%      15.1%

              Access to help to stay in the home

              Poor/fair                            38.5%                 41.7%      32.4%

                                Good               39.1%                 42.3%      52.7%        0.0323

              Excellent                            22.4%                 16.0%      14.9%

              A place that meets the needs of persons with disabilities

              Poor/fair                            38.4%                 41.5%      30.1%

                                Good               41.8%                 43.5%      57.4%        0.0073

              Excellent                            19.8%                 15.0%      12.5%

              Efforts to prevent abuse or neglect

              Poor/fair                            34.0%                 39.9%      29.3%

                                Good               45.3%                 46.0%      57.1%        0.0463

              Excellent                            20.7%                 14.1%      13.6%

              Availability of services that meet the needs of abused

              Poor/fair                            37.4%                 38.3%      34.5%

                                Good               46.2%                 46.8%      53.8%        0.1704

              Excellent                            16.4%                 14.9%      11.7%

              •	 Those with a high school diploma or less were more likely to rate as excellent their community as a place that
                   meets the needs of the elderly; 25% indicated this compared to 15-18% of recipients of higher education.

              •	 Those with less education were also more likely to rate as excellent help to stay in the home; 22% indicated
                   this compared to 15-16% of recipients of higher education.

              •	 Those with less education were more likely to rate as excellent their community as a place that meets the
                   needs of persons with disabilities; 20% rated this as excellent compared to 13-15% of recipients of higher
                   education

              •	 Those with a high school diploma or less education were more likely to rate as excellent efforts to prevent
                   abuse or neglect. They were, however, also more likely to say this was fair or poor.

              ECONOMIC ASPECTS                     High School            Some       College or  Difference in
                                                   grad or less       college/voc.  adv. degree    rating by
                                                                                    350 (44.9%)   education
                                                   199 (25.6%)        230 (29.5%)
                                                                                       52.6%        0.0007
              Availability of jobs with wages that offer a good standard of living     37.0%
                                                                                       10.4%        <.0001
              Poor/fair                            66.3%                 61.9%
                                                                                       17.5%
                                Good               28.8%                 33.7%         43.7%
                                                                                       38.8%
              Excellent                            4.9%                  4.4%

              Ability to meet basic needs

              Poor/fair                            31.3%                 33.9%

                                Good               56.8%                 48.0%

              Excellent                            11.9%                 18.1%

2 | APPENDIX  164 COMPASS NOW 2015