
Page 183 - 2015 Compass Now
P. 183
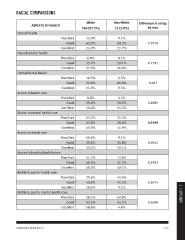
RACIAL COMPARISONS                                      White    Non-White  Difference in rating  2 | APPENDIX
                                                    740 (97.2%)  21 (2.8%)         by race
             ASPECTS OF HEALTH                                                     0.2978
                                                       12.5%        9.1%           0.1297
 Overall health                                        63.2%       68.2%            0.063
                                         Poor/fair     24.3%       22.7%           0.4889
                                             Good                                  0.0190
                                         Excellent      6.9%        9.1%           0.6644
                                                       55.2%       59.1%           0.5303
 Overall mental health                                 37.9%       31.8%           0.5614
                                         Poor/fair                                 0.3688
                                             Good      16.5%        9.5%
                                         Excellent     52.0%       81.0%
                                                       31.5%        9.5%
 Overall dental health
                                         Poor/fair      8.6%        4.5%
                                             Good      35.0%       50.0%
                                         Excellent     56.4%       45.5%

 Access to health care                                 12.2%       25.5%
                                         Poor/fair     42.8%       28.6%
                                             Good      45.0%       45.9%
                                         Excellent
                                                       10.5%        9.1%
 Access to mental health care                          35.8%       31.8%
                                         Poor/fair     53.7%       59.1%
                                             Good
                                         Excellent     11.2%       13.6%
                                                       40.5%       27.3%
 Access to dental care                                 48.3%       59.1%
                                         Poor/fair
                                             Good      35.6%       45.4%
                                         Excellent     43.6%       45.5%
                                                       20.8%        9.1%
 Access to healthy food choices
                                         Poor/fair     38.7%       49.9%
                                             Good      42.5%       45.5%
                                         Excellent     18.8%        4.6%

 Ability to pay for health care
                                         Poor/fair
                                             Good
                                         Excellent

 Ability to pay for mental health care
                                         Poor/fair
                                             Good
                                         Excellent

COMPASS NOW 2015                                                            175