Page 186 - 2015 Compass Now
P. 186

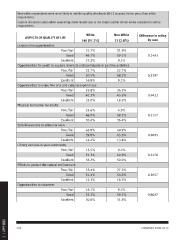
Non-white respondents were more likely to rate the quality of schools 4K-12 as good, fair or poor, than white
              respondents.

              Caution should be taken when examining these results due to the small number of non-white compared to white
              respondents.

              ASPECTS OF QUALITY OF LIFE                      White      Non-White                 Difference in rating
                                                          740 (97.2%)    21 (2.8%)                        by race
                                                                                                          0.2403
              Leisure time opportunities                                                                  0.3287
                                                                                                          0.9432
                                              Poor/fair   27.7%          31.8%                            0.2157
                                                                                                          0.9605
                                                  Good    49.1%          59.1%                            0.2458
                                                                                                          0.5057
                                              Excellent   23.2%          9.1%                             0.8007

              Opportunities for youth to explore interests and participate in positive activities

                                              Poor/fair   32.7%          22.7%

                                                  Good    50.5%          68.2%

                                              Excellent   16.8%          9.1%

              Opportunities to enjoy fine arts and cultural experiences

                                              Poor/fair   35.8%          36.3%

                                                  Good    41.2%          45.5%

                                              Excellent   23.0%          18.2%

              Physical recreation for adults

                                              Poor/fair   23.6%          4.5%

                                                  Good    46.0%          59.1%

                                              Excellent   30.4%          36.4%

              Safe bike routes to school or work

                                              Poor/fair   45.8%          40.9%

                                                  Good    39.8%          45.5%

                                              Excellent   14.4%          13.6%

              Library services in your community

                                              Poor/fair   15.5%          9.1%

                                                  Good    51.3%          40.9%

                                              Excellent   33.2%          50.0%

              Efforts to protect the natural environment

                                              Poor/fair   35.4%          27.2%

                                                  Good    51.4%          54.6%

                                              Excellent   13.2%          18.2%

              Opportunities to volunteer

                                              Poor/fair   16.1%          9.1%

                                                  Good    53.3%          59.1%

                                              Excellent   30.6%          31.8%

2 | APPENDIX  178 COMPASS NOW 2015
   181   182   183   184   185   186   187   188   189   190   191