Page 181 - 2015 Compass Now
P. 181

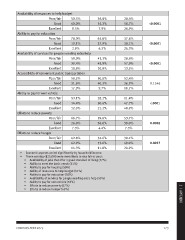
Availability of resources to help budget

                  Poor/fair      50.5%                  36.8%           28.4%
                                                                        50.7%
                           Good  40.0%                  55.3%           20.9%  <0.0001
                                                                               <0.0001
                  Excellent      9.5%                   7.9%            37.6%  <0.0001
                                                                        38.1%  0.1546
Ability to pay for education                                            24.3%  <.0001
                                                                               0.0002
                  Poor/fair      78.0%                  65.8%           28.6%  0.0027
                                                                        57.9%
                           Good  19.1%                  27.9%           13.5%

                  Excellent      2.9%                   6.3%            52.4%
                                                                        36.9%
Availability of services for people needing extra help                  10.7%

                  Poor/fair      50.0%                  43.3%           11.4%
                                                                        47.7%
                           Good  39.4%                  45.9%           40.9%

                  Excellent      10.6%                  10.8%           53.7%
                                                                        39.0%
Accessibility of convenient public transportation                       7.3%

                  Poor/fair      50.5%                  50.0%           30.1%
                                                                        49.0%
                           Good  31.6%                  40.3%           20.9%

                  Excellent      17.9%                  9.7%

Ability to pay for own vehicle

                  Poor/fair      53.1%                  28.2%

                           Good  34.4%                  50.6%

                  Excellent      12.5%                  21.2%

Efforts to reduce poverty

                  Poor/fair      66.7%                  59.0%

                           Good  26.0%                  36.6%

                  Excellent      7.3%                   4.4%

Efforts to reduce hunger

                  Poor/fair      42.8%                  34.6%

                           Good  42.9%                  53.6%

                  Excellent      14.3%                  11.8%

•	 Economic aspects varied significantly by household income.                                2 | APPENDIX
•	 Those earning <$25,000 were more likely to rate fair or poor:

    •	 Availability of jobs that offer a good standard of living (77%)
    •	 Ability to meet the basic needs (51%)
    •	 Ability to pay for housing (50%)
    •	 Ability of resources to help budget (51%)
    •	 Ability to pay for education (78%)
    •	 Availability of services for people needing extra help (50%)
    •	 Ability to pay for own vehicle (53%)
    •	 Efforts to reduce poverty (67%)
    •	 Efforts to reduce hunger (43%)

COMPASS NOW 2015                                                                        173
   176   177   178   179   180   181   182   183   184   185   186