
Page 179 - 2015 Compass Now
P. 179
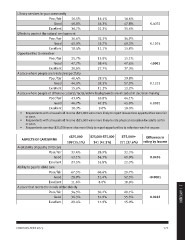
Library services in your community

                  Poor/fair         16.5%        14.4%            16.6%

                  Good              46.8%        54.3%            47.8%        0.4332

                  Excellent         36.7%        31.3%            35.6%

Efforts to protect the natural environment

                  Poor/fair         36.6%        33.2%            34.9%

                  Good              45.0%        55.7%            49.3%        0.1074

                  Excellent         18.4%        11.1%            15.8%

Opportunities to volunteer

                  Poor/fair         25.7%        13.9%            15.1%

                  Good              47.7%        58.4%            47.6%        <.0001

                  Excellent         26.6%        27.7%            37.3%

A place where people are treated respectfully

                  Poor/fair         40.4%        29.5%            29.8%

                  Good              44.0%        59.3%            57.0%        0.1225

                  Excellent         15.6%        11.2%            13.2%

A place where people of different cultural/racial/ethnic backgrounds are included in decision-making

                  Poor/fair         43.0%        43.8%            44.1%

                  Good              46.7%        47.2%            45.9%        0.8882

                  Excellent         10.3%        9.0%             10.0%

•	 Respondents with a household income <$25,000 were more likely to report leisure time opportunities were fair
     or poor.

•	 Respondents with a household income <$25,000 were more likely to rate physical recreation for adults as fair
     or poor.

•	 Respondents earning <$25,000 were also more likely to report opportunities to volunteer was fair or poor.

ASPECTS OF CAREGIVING                <$25,000    $25,000-$75,000   $75,000+      Difference in
                                    109 (15.1%)    341 (47.3%)    271 (37.6%)  rating by income

Availability of quality child care                     28.9%         32.5%           0.0476
                                                       54.3%         45.0%
                  Poor/fair         33.4%              16.8%         22.5%          <0.0001

                  Good              43.1%              60.6%         29.7%           0.0242
                                                       31.4%         52.3%
                  Excellent         23.5%               8.0%         18.0%

Ability to pay for child care                          30.2%         29.7%
                                                       51.9%         55.3%
                  Poor/fair         67.5%              17.9%         15.0%

                  Good              20.9%

                  Excellent         11.6%

A place that meets the needs of the elderly                                                                      2 | APPENDIX

                  Poor/fair         34.3%

                  Good              36.3%

                  Excellent         29.4%

COMPASS NOW 2015                                                                                      171