Page 184 - 2015 Compass Now
P. 184

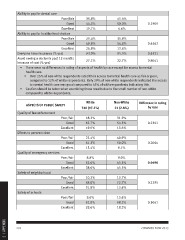
Ability to pay for dental care

                                              Poor/fair         35.8%        45.4%

                                               Good             44.5%        50.0%      0.1909

                                              Excellent         19.7%        4.6%

              Ability to pay for healthy food choices

                                              Poor/fair         25.4%        31.8%

                                               Good             49.8%        54.6%      0.6562

                                              Excellent         24.8%        13.6%

              Everyone have insurance (% yes)                   93.0%        95.5%      0.6531

              Avoid seeing a doctor in past 12 months           27.1%        22.7%      0.8041
              because of cost (% yes)

              •	 There were no differences in rating of aspects of health by race except for access to mental
                  health care.
                 •	 Over 25% of non-white respondents rated their access to mental health care as fair or poor,
                      compared to 12% of white respondents. Only 29% of non-white respondents indicated the access
                      to mental health care was good compared to 43% of with respondents indicating this.

              •	 Caution should be taken when examining these results due to the small number of non-white
                  compared to white respondents.

                     ASPECTS OF PUBLIC SAFETY                       White    Non-White  Difference in rating
                                                                740 (97.2%)  21 (2.8%)         by race
              Quality of law enforcement                                                       0.2341
                                                     Poor/fair     18.3%       31.9%
                                                          Good     62.7%       54.5%           0.2064
                                                     Excellent     19.0%       13.6%
                                                                                               0.0496
              Efforts to prevent crime                             23.4%       40.9%
                                                     Poor/fair     61.2%       50.0%           0.2295
                                                          Good     15.4%        9.1%
                                                     Excellent                                 0.1061
                                                                    8.8%        9.0%
              Quality of emergency services                        52.6%       45.5%
                                                     Poor/fair     38.6%       45.5%
                                                          Good
                                                     Excellent     10.2%       13.7%
                                                                   58.0%       72.7%
              Safety of neighborhood                               31.8%       13.6%
                                                     Poor/fair
                                                          Good      8.6%       13.6%
                                                     Excellent     62.8%       68.2%
                                                                   28.6%       18.2%
              Safety of schools
                                                     Poor/fair
                                                          Good
                                                     Excellent

2 | APPENDIX  176 COMPASS NOW 2015
   179   180   181   182   183   184   185   186   187   188   189