
Page 185 - 2015 Compass Now
P. 185
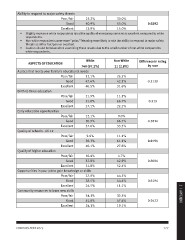
Ability to respond to major safety threats

                               Poor/fair    25.2%        30.0%

                               Good         60.9%        55.0%      0.0292

                               Excellent    13.9%        15.0%

•	 Slightly more non-white respondents rated the quality of emergency services as excellent compared to white
     respondents.

•	 Non-white respondents were more “polar,” Meaning more likely to rate the ability to respond to major safety
     threats as either fair/poor or excellent.

•	 Caution should be taken when examining these results due to the small number of non-white compared to
     white respondents.

ASPECTS OF EDUCATION                            White    Non-White  Difference in rating
                                            740 (97.2%)  21 (2.8%)         by race
                                                                           0.3138
A place that meets your family’s educational needs         26.3%            0.519
                                                           42.1%           0.3814
                               Poor/fair    12.1%          31.6%           0.0154
                                                                           0.6004
                               Good         47.4%          11.1%           0.6194
                                                           66.7%           0.9422
                               Excellent    40.5%          22.2%

Birth-to-three education                                    0.0%
                                                           66.7%
                               Poor/fair    21.9%          33.3%

                               Good         51.0%          11.1%
                                                           61.1%
                               Excellent    27.1%          27.8%

Early education opportunities                               4.7%
                                                           42.9%
                               Poor/fair    12.1%          52.4%

                               Good         50.9%          44.5%
                                                           44.4%
                               Excellent    37.0%          11.1%

Quality of schools - 4K-12                                 33.3%
                                                           47.6%
                               Poor/fair    9.6%           19.1%

                               Good         50.3%

                               Excellent    40.1%

Quality of higher education

                               Poor/fair    10.4%

                               Good         37.8%

                               Excellent    51.8%

Opportunities in your job to gain knowledge or skills

                               Poor/fair    37.0%

                               Good         38.5%

                               Excellent    24.5%                                                               2 | APPENDIX

Community resources to learn new skills

                               Poor/fair    34.1%

                               Good         41.8%

                               Excellent    24.1%

COMPASS NOW 2015                                                            177