
Page 173 - 2015 Compass Now
P. 173
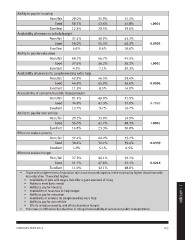
Ability to pay for housing

                  Poor/fair       29.0%                 35.9%  15.2%

                            Good  58.7%                 43.6%  45.8%  <.0001

                  Excellent       12.3%                 20.5%  39.0%

Availability of resources to help budget

                  Poor/fair       37.4%                 38.9%  41.2%

                            Good  56.0%                 51.5%  40.2%  0.0002

                  Excellent               6.6%          9.6%   18.6%

Ability to pay for education

                  Poor/fair       68.1%                 66.7%  43.5%

                            Good  27.6%                 26.2%  36.2%  <.0001

                  Excellent               4.3%          7.1%   20.3%

Availability of services for people needing extra help

                  Poor/fair       43.9%                 46.5%  29.4%

                            Good  44.6%                 45.0%  56.6%  0.0006

                  Excellent       11.5%                 8.5%   14.0%

Accessibility of convenient public transportation

                  Poor/fair       51.4%                 49.0%  51.5%

                            Good  34.9%                 41.3%  37.8%  0.7097

                  Excellent       13.7%                 9.7%   10.7%

Ability to pay for own vehicle

                  Poor/fair       29.2%                 35.0%  14.9%

                            Good  56.0%                 41.7%  48.3%  <.0001

                  Excellent       14.8%                 23.3%  36.8%

Efforts to reduce poverty

                  Poor/fair       57.4%                 62.2%  53.7%

                            Good  38.6%                 32.7%  39.4%  0.0359

                  Excellent               4.0%          5.1%   6.9%

Efforts to reduce hunger

                  Poor/fair       37.3%                 40.1%  29.1%

                            Good  51.7%                 47.8%  52.1%  0.0216

                  Excellent       11.0%                 12.1%  18.8%

•	 Those with a higher level of education rate most economic aspects in the community higher than those with       2 | APPENDIX
     less education. They rated higher:
    •	 Availability of jobs with wages that offer a good standard of living
    •	 Ability to meet basic needs
    •	 Ability to pay for housing
    •	 Availability of resources to help budget
    •	 Ability to pay for education
    •	 Availability of services for people needing extra help
    •	 Ability to pay for own vehicle
    •	 Efforts to reduce poverty, and efforts to reduce hunger.

•	 There was no difference by education in rating of accessibility of convenient public transportation.

COMPASS NOW 2015                                                                                              165