
Page 175 - 2015 Compass Now
P. 175
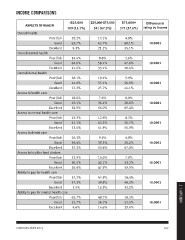
INCOME COMPARISONS

ASPECTS OF HEALTH                  <$25,000    $25,000-$75,000   $75,000+      Difference in
                                  109 (15.1%)    341 (47.3%)    271 (37.6%)  rating by income

Overall health                                       13.1%          4.8%          <0.0001
                                                     65.7%         60.1%          <0.0001
                       Poor/fair       28.2%         21.2%         35.1%          <0.0001
                                                                                  <0.0001
                       Good            62.7%          8.8%          2.6%          <0.0001
                                                     58.1%         47.0%          <0.0001
                       Excellent       9.1%          33.1%         50.4%          <0.0001
                                                                                  <0.0001
Overall mental health                                19.2%          5.9%          <0.0001
                                                     55.1%         50.0%
                       Poor/fair       14.4%         25.7%         44.1%

                       Good            64.0%          7.6%          6.0%
                                                     36.4%         28.6%
                       Excellent       21.6%         56.0%         65.4%

Overall dental health                                12.8%          8.3%
                                                     45.3%         36.7%
                       Poor/fair       38.1%         41.9%         55.0%

                       Good            44.6%          9.9%          4.8%
                                                     39.5%         28.2%
                       Excellent       17.3%         50.6%         67.0%

Access to health care                                10.0%          7.8%
                                                     42.1%         33.2%
                       Poor/fair       18.0%         47.9%         59.0%

                       Good            45.1%         43.9%         18.6%
                                                     39.8%         48.3%
                       Excellent       36.9%         16.3%         33.1%

Access to mental health care                         48.7%         18.5%
                                                     36.7%         52.1%
                       Poor/fair       25.3%         14.6%         29.4%

                       Good            41.1%

                       Excellent       33.6%

Access to dental care

                       Poor/fair       26.3%

                       Good            36.4%

                       Excellent       37.3%

Access to healthy food choices

                       Poor/fair       22.9%

                       Good            50.5%

                       Excellent       26.6%

Ability to pay for health care

                       Poor/fair       57.2%

                       Good            37.3%

                       Excellent       5.5%                                                    2 | APPENDIX

Ability to pay for mental health care

                       Poor/fair       62.7%

                       Good            32.7%

                       Excellent       4.6%

COMPASS NOW 2015                                                             167