
Page 176 - 2015 Compass Now
P. 176
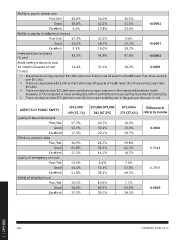
Ability to pay for dental care

              Poor/fair                                65.8%      44.0%            15.5%

                                       Good            28.8%      42.2%            51.5%        <0.0001

              Excellent                                5.4%       13.8%            33.0%

              Ability to pay for healthy food choices

              Poor/fair                                47.3%      32.3%            9.6%

                                       Good            43.6%      48.7%            52.2%        <0.0001

              Excellent                                9.1%       19.0%            38.2%

              Everyone have insurance                  83.3%      91.8%            97.8%        <0.0001
              (% yes)

              Avoid seeing a doctor in past            32.4%      32.2%            20.2%        0.0004
              12 months because of cost
              (% yes)

              •	 Respondents earning less than $25,000 were more likely to rate all aspects of health lower than those earning
                   over $25,000.

              •	 Those earning between $25,000 and $75,000 rated all aspects of health lower than those earning more than
                   $75,000.

              •	 Those earning less than $25,000 were more likely to report someone in the household is without health
                   insurance (17%) compared to those earning $25,000-75,000 (8%) and those earning more than $75,000 (2%).

              •	 Those earning less than $75,000 were more likely to report avoiding care in the past year because of cost.

                ASPECTS OF PUBLIC SAFETY              <$25,000    $25,000-$75,000   $75,000+      Difference in
                                                     109 (15.1%)    341 (47.3%)    271 (37.6%)  rating by income
              Quality of law enforcement
                                          Poor/fair     27.2%           20.7%         10.0%           0.0004
                                               Good     55.5%           59.2%         70.3%
                                          Excellent     17.3%           20.1%         19.7%           0.3341

              Efforts to prevent crime                  20.9%           26.7%         20.8%           0.2874
                                          Poor/fair     61.8%           59.2%         62.5%
                                               Good     17.3%           14.1%         16.7%           0.0029
                                          Excellent
                                                        13.6%            8.4%          7.0%
              Quality of emergency services             44.6%           53.4%         52.8%
                                          Poor/fair     41.8%           38.2%         40.2%
                                               Good
                                          Excellent     16.5%           10.0%          7.7%
                                                        56.0%           60.9%         53.9%
              Safety of neighborhood                    27.5%           29.1%         38.4%
                                          Poor/fair
                                               Good
                                          Excellent

2 | APPENDIX  168 COMPASS NOW 2015