
Page 177 - 2015 Compass Now
P. 177
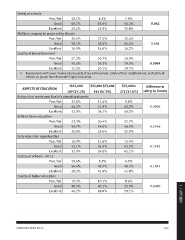
Safety of schools

                   Poor/fair      10.1%             8.5%             7.9%

                            Good  66.7%             65.6%            56.3%        0.042

                   Excellent      23.2%             25.9%            35.8%

Ability to respond to major safety threats

                   Poor/fair      25.5%             27.5%            21.4%

                            Good  58.5%             58.5%            64.4%        0.686

                   Excellent      16.0%             14.0%            14.2%

Quality of law enforcement

                   Poor/fair      27.2%             20.7%            10.0%

                            Good  55.5%             59.2%            70.3%        0.0004

                   Excellent      17.3%             20.1%            19.7%

•	 Respondents with lower income rated quality of law enforcement, safety of their neighborhood, and safety of
     schools as poorer than those with higher education.

ASPECTS OF EDUCATION               <$25,000         $25,000-$75,000   $75,000+      Difference in
                                  109 (15.1%)         341 (47.3%)    271 (37.6%)  rating by income

A place that meets your family’s educational needs                       9.8%           0.0006
                                                                        40.2%
                   Poor/fair      22.8%             11.4%               50.0%           0.5546

                            Good  44.3%             51.9%               21.7%           0.2782
                                                                        46.3%
                   Excellent      32.9%             36.7%               32.0%           0.1843

Birth-to-three education                                                13.4%           0.0060
                                                                        43.5%
                   Poor/fair      23.3%             20.4%               43.1%

                            Good  50.7%             54.6%                8.9%
                                                                        48.3%
                   Excellent      26.0%             25.0%               42.8%

Early education opportunities                                            8.6%
                                                                        32.3%
                   Poor/fair      10.9%             11.6%               59.1%

                            Good  52.1%             54.4%

                   Excellent      37.0%             34.0%

Quality of schools - 4K-12

                   Poor/fair      15.4%             9.5%

                            Good  56.4%             48.7%

                   Excellent      28.2%             41.8%

Quality of higher education

                   Poor/fair      15.3%             10.1%

                            Good  38.5%             40.1%                                                       2 | APPENDIX

                   Excellent      46.2%             49.8%

COMPASS NOW 2015                                                                          169